Case study - Caribbean
AUDIT
Client Overview
C&I places family at the core of its operations. For over five decades, the company has adhered to their ethos of “Family First,” emphasizing trust and satisfaction. The brand provides quality products at affordable prices for every stage of their customers’ lives, from excited brides to nurturing mothers, proud grandmothers, vibrant teenagers, and ambitious professionals. C&I is more than a leading retailer; it is a family-driven business that understands and addresses the needs of each life phase, reflecting their own experiences in their offerings.
Summary
We created reports for C&I in Looker Studio which reflected monthly sales performance and user engagement analysis based on sessions, bounce rates, and user interaction. In addition to this, we also helped monitor their conversion funnels, marketing campaign performance, and eCommerce product & brand analysis.
These reports provided actionable insights to drive informed decisions and improvements. The reports included:
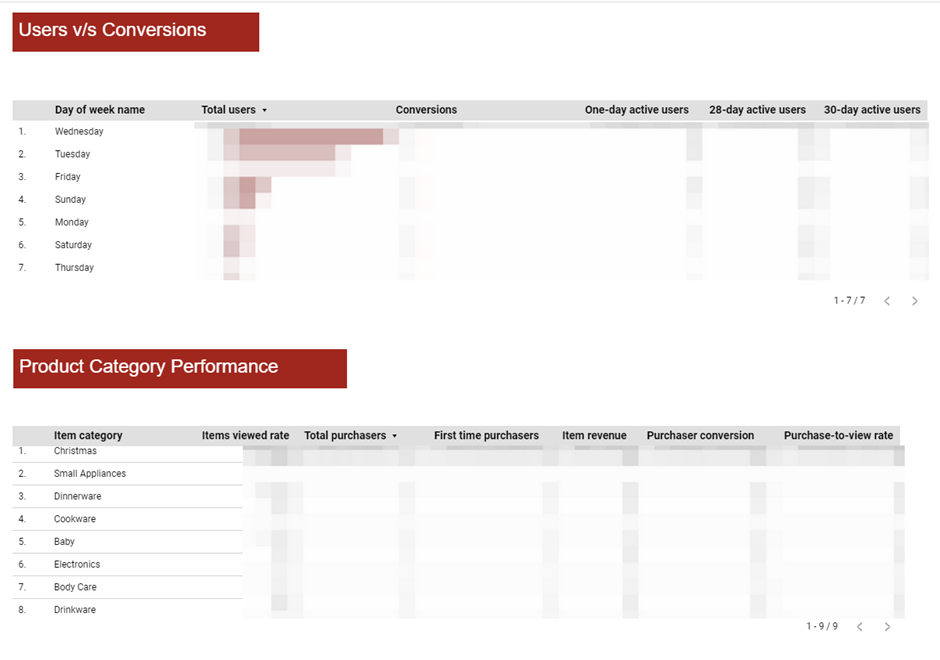
- A granular segmentation by channel group, day of week, user type (new vs. returning), and item category
- Scorecards that provided clear visualizations of crucial user behavior and conversion metrics.
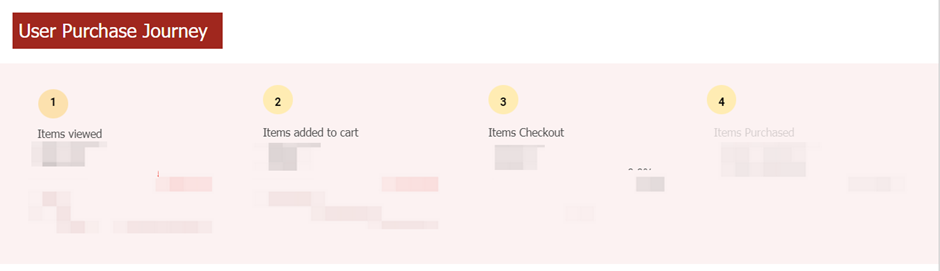
- An eCommerce journey path to help understand user interactions and identify optimization opportunities.
Requirements
C&I was looking to unlock a deeper understanding of their marketing attribution. To achieve this, they envisioned an overview section, marketing attribution section, and product performance section. This required a visually engaging dashboard that highlights segmented events through a streamlined interface, with an added weekly breakdown for a thorough performance analysis.
Solution
Our solution was a cumulative report that was organized into three sections: Overview, Marketing Attribution, and Ecommerce.
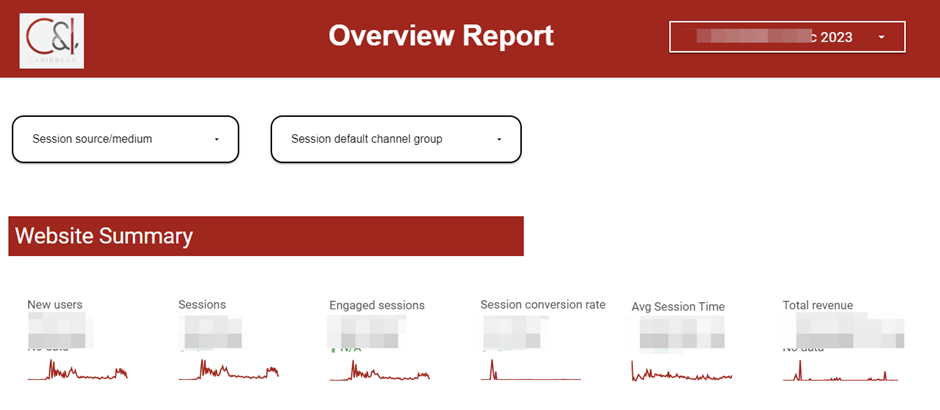
Overview Section
This section provided a summary of website metrics, including user behavior metrics such as
- Total Users
- Engaged Sessions
- Session Duration
- Engagement Rate
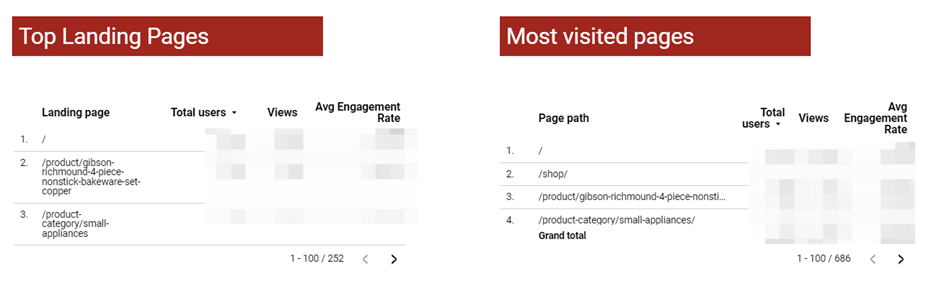
Along with this, comparative trends, such as sessions versus engaged sessions, were visualized. The overview section also featured top landing pages, most visited pages, and user journey metrics from item view to purchase. The most common search keywords were included, and the report could be filtered by specific channel groups and source/medium.
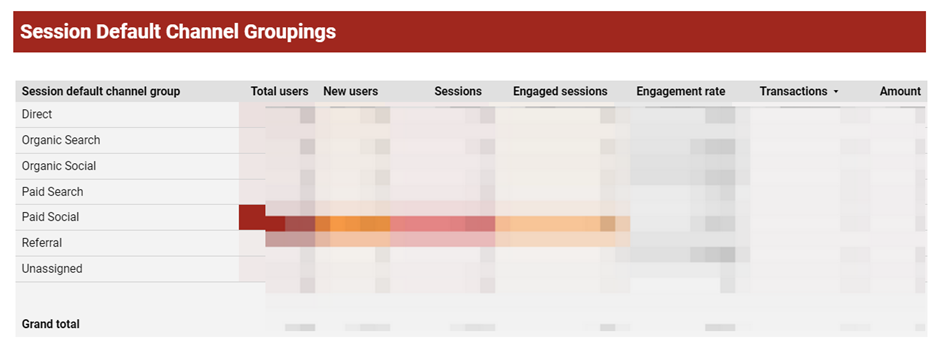
Marketing Attribution Section
This page detailed both the custom and default channel groups, presenting comprehensive information on marketing attribution, including top pages and conversions.
ECommerce Section
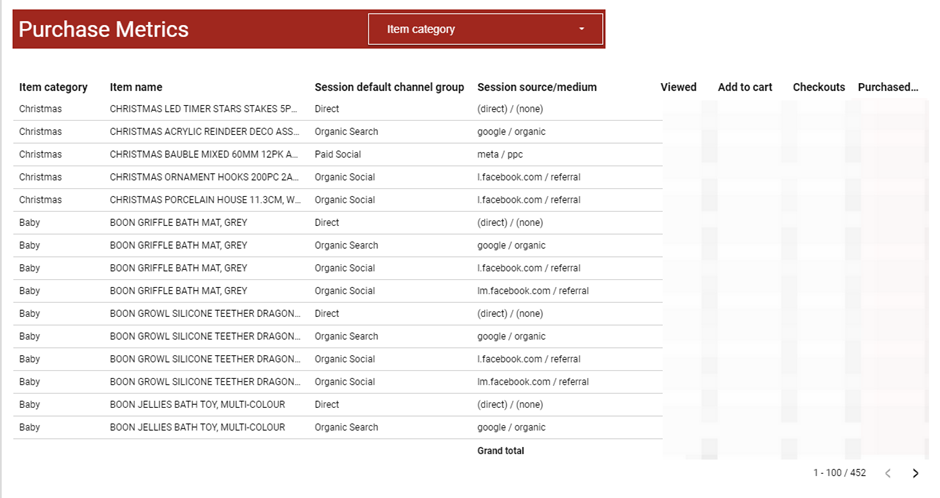
The ecommerce section focused on purchase metrics, including total purchasers, first-time purchasers, total revenue, purchase conversion rates, and purchase-to-view ratios. It also analyzed conversions by day of the week and item performance by category, with item names and category-wise filters provided.
From Scattered Data to Effective Changes
Our report offered a detailed analysis of user behavior, marketing effectiveness, and eCommerce performance. By leveraging these insights, C&I was able to identify their areas of strength and weaknesses, and make the best out out of our suggested strategies. This helped amp up their website engagement, marketing attribution, and sales metrics.
Ready to improve your business with the help of data? Contact us and make the b est out of our data-driven solutions.
Results
The detailed backup provided for the client’s Universal Analytics (UA) data ensured a reliable and accessible resource for ongoing analysis. The Looker Studio report offered a comprehensive view of historical data, preserving all key insights during the transition from UA. With features like date range control, aggregated scorecards, pie charts, and customizable views, the report made it easy to analyze and extract valuable insights, ensuring that no critical information was lost and providing flexibility for future updates.
Conclusion
The backup and Looker Studio report provided the client with a clear and accessible view of their Universal Analytics data. The report preserved all important insights and made it easy to analyze historical data. Features like date range selection, scorecards, charts, and filters ensured that no valuable information was lost and that the report can be easily updated in the future. This solution streamlined the transition and supported ongoing data analysis and decision-making.