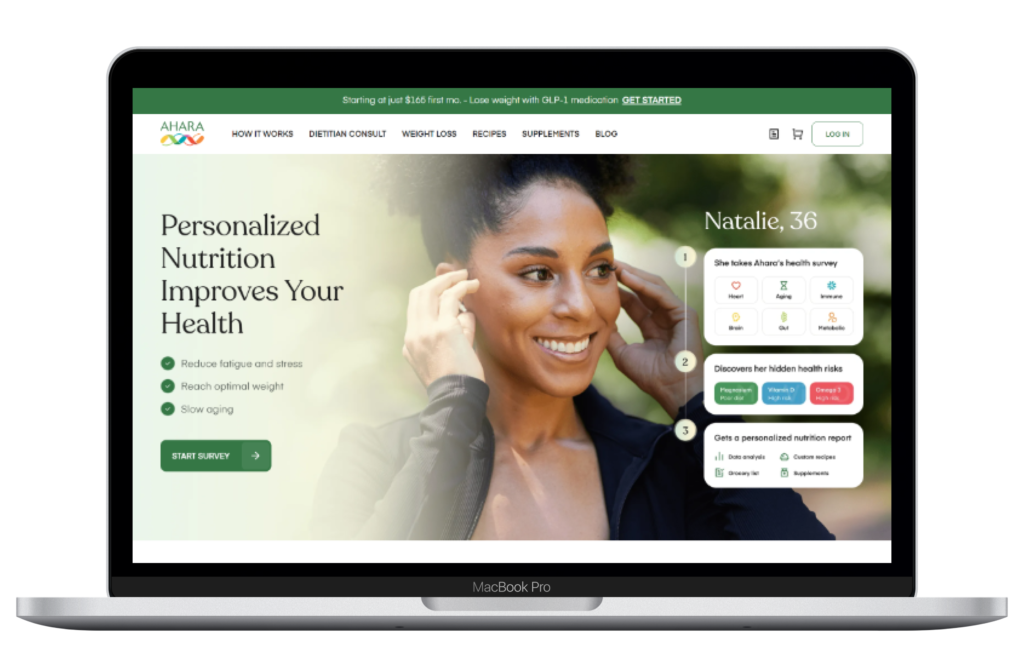
Case Study - Ahara Corporation
AUDIT
Requirements
Our client sought a thorough review of Google Analytics and Google Tag Manager to figure out why their data was inaccurate and why some details were missing in their conversion events setup.
We were also tasked with adding new events to improve the understanding of user navigation on their website. Following this, we created a comprehensive plan detailing the changes needed to track data correctly. This plan not only ensures data accuracy but also provides a clear roadmap for reporting and improvements. To present the data effectively, we developed a Looker report.

Our Approach
We organized the project into distinct phases:
- Audit Phase: Initially, we thoroughly examined the client’s Google Analytics 4 (GA4) and Google Tag Manager (GTM) to assess their current setup.
- Correction and Implementation Phase: Next, we adjusted the tracking codes and added new ones to ensure comprehensive tracking. After making these updates, we performed another audit to verify the accuracy of the tracking.
- Reporting Phase: Finally, we developed a complete dashboard to present the collected data. This dashboard offered a comprehensive overview of the website’s performance, providing a clear picture of its functionality.
Phase 1: Audit
During our review, we found several issues with our GA4 setup.
- Specifically, we saw that data from form interactions was getting reported without any form submissions.
- Also, some events weren’t set up right, making the data inaccurate.
- Internal traffic was not excluded from the website making the data inaccurate.
- The landing page had many ‘not set’ values.
- Conversions were missing for mobile and tablet e-commerce data, while desktop conversions were reported correctly.
Solution
We implemented several key changes to address the issues:
- Turned off enhanced measurements in the GA4 setup to eliminate unnecessary form interactions.
- Increased the session timeout duration to resolve the ‘not set’ values from the landing page.
- Defined a targeted audience group for marketing purposes.
- Events setup was done accurately, fulfilling a critical aspect of the client’s requirements.
We then provided the client with a comprehensive measurement plan. In this plan, we included all the events that could be tracked and analyzed. We made sure to align these events with the client’s business goals and key performance indicators (KPIs).
Moreover, the plan outlined the various reports that could be generated once the website tracking system was in place.
Phase 2: Correction and Implementation
First, we proceeded with the implementation of tags that included:
- CTA Clicks: Tracking interactions with call-to-action buttons.
- Form Submissions: Capturing user registrations.
- Outbound Clicks: Monitoring links to social media profiles.
- Navigation Clicks: Tracking clicks on menu items.
- Vimeo Video Tracking: Monitoring video progress and status.
- Content Grouping: Custom grouping setup for each article category.
- Shallow Lead Event: Recording when users provide contact information.
Additionally, custom definitions were set up to pass custom event parameters, including article category, video duration percentage, video status, and user ID.
Next, we addressed the User Properties setup.
We utilized the User ID as a parameter in the data layer to collect user information. Initially, it was sent with the configuration tag during window loading, but the User ID was not yet available in the data layer at that time. To resolve this, we adjusted the trigger condition to DOM Ready, which corrected the issue.
Phase 3: Delivering Results
In the final phase, we created a comprehensive report using Looker Studio to present the data in a visual and accessible format for the client. The report is organized into three pages, each focusing on different aspects of the analysis:
- The first page provides an overview with key details about the website, including session-level metrics, page views, top landing pages, marketing attributions, and user distribution by device and country.
- The second page highlights business objectives, showcasing tracking for CTA clicks, navigation clicks, and content grouping to evaluate article performance. It also covers video interactions, social media shares, popular memberships, and user interest in supplements.
- The third page examines product performance, detailing the user journey from viewing to purchasing. It categorizes products, identifies top-performing categories, and highlights revenue generation from different segments such as device and country.


