Case Study - Bolton Abbey
AUDIT
Client Overview
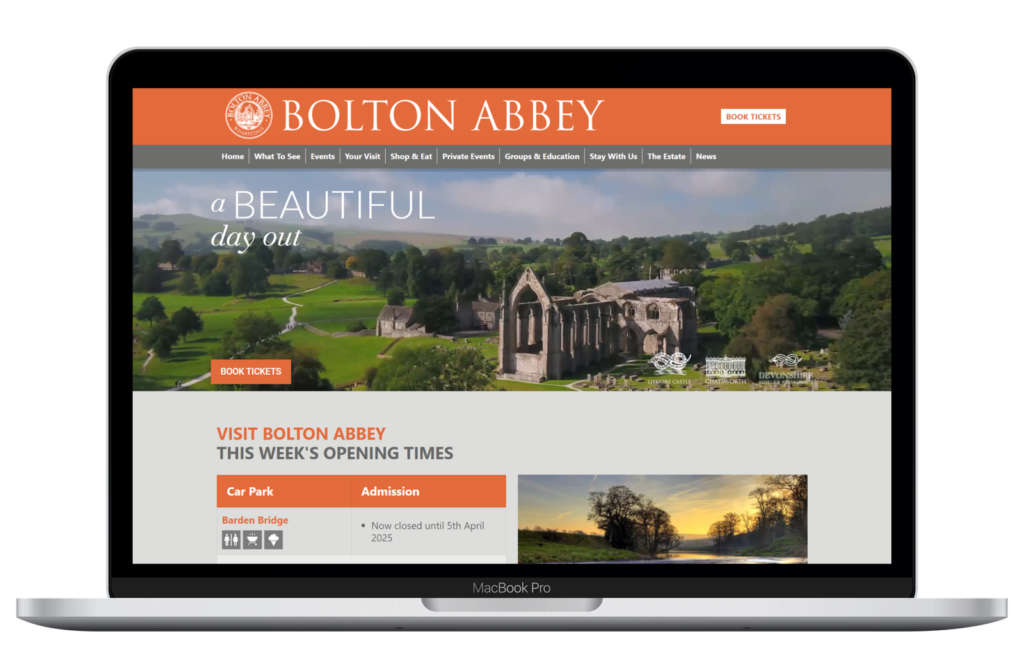
Bolton Abbey is a premier heritage destination nestled in the heart of the Yorkshire Dales, offering visitors a rich blend of history, culture, and natural beauty. As the site of the historic 12th-century Augustinian monastery, the Abbey and its surrounding estate span over 30,000 acres, attracting tourists from across the globe. Visitors can explore a variety of attractions, including the magnificent Priory Church, scenic woodland walks, and the iconic stepping stones across the River Wharfe.
Requirements
- Audience Overview
- Users: Total number of users visiting the site.
- New vs. Returning Users: Breakdown of first-time visitors vs. repeat visitors.
- Sessions: Number of sessions on the site.
- Session Duration: Average time users spend on the site.
- Bounce Rate: Percentage of single-page visits.
- Demographics: Age, gender, and interests of the audience.
- Acquisition Data
- Traffic Source/Medium: Channels driving traffic (organic, paid, referral, etc.).
- Campaign Performance: Data from specific marketing campaigns, including UTM parameters.
- Referral Sources: Websites referring traffic to Bolton Abbey’s site.
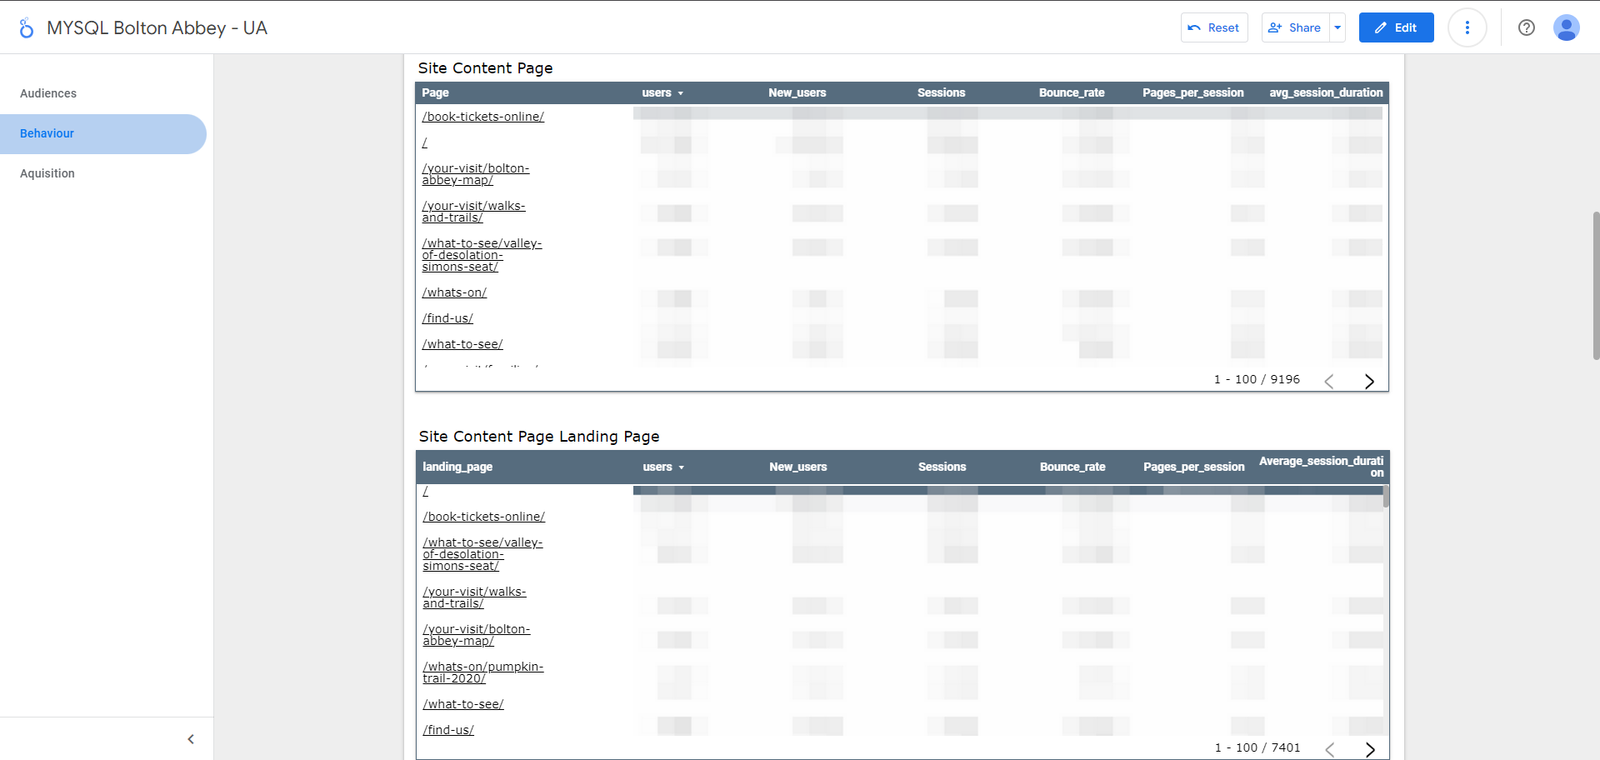
- Behavior Data
- Pageviews: Total number of pages viewed.
- Top Pages: Most visited pages, including landing and exit pages.
- Site Search Data: Queries entered in the site’s search bar, showing user intent.
- Events: User interactions like clicks on buttons, video plays, and form submissions.
- Site Speed: Average page load time and any issues affecting site performance.
- Conversion Data
- Goals: Data on goal completions, including bookings, sign-ups, and downloads.
- E-commerce (if applicable): Transactions, revenue, average order value, and conversion rate.
- Assisted Conversions: Channels contributing to conversions.
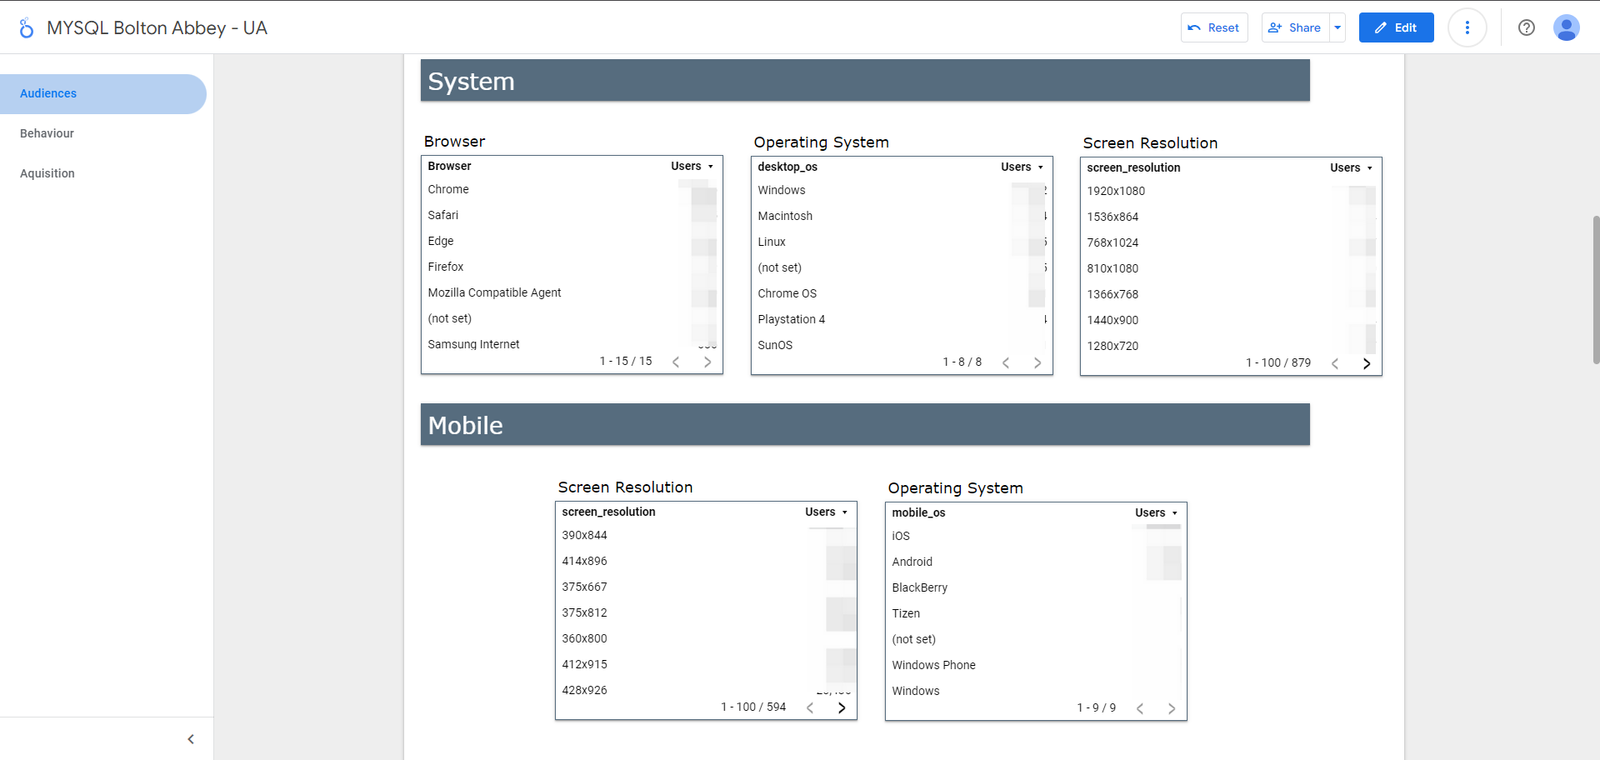
- Technology Reports
- Device Category: Mobile, tablet, desktop breakdown.
- Browser and OS: Details on what browsers and operating systems users are using.
- Screen Resolution: Information on screen sizes, which can influence site design decisions.
- Location Data
- Geography: Information on where users are located, down to city-level details.
Solution
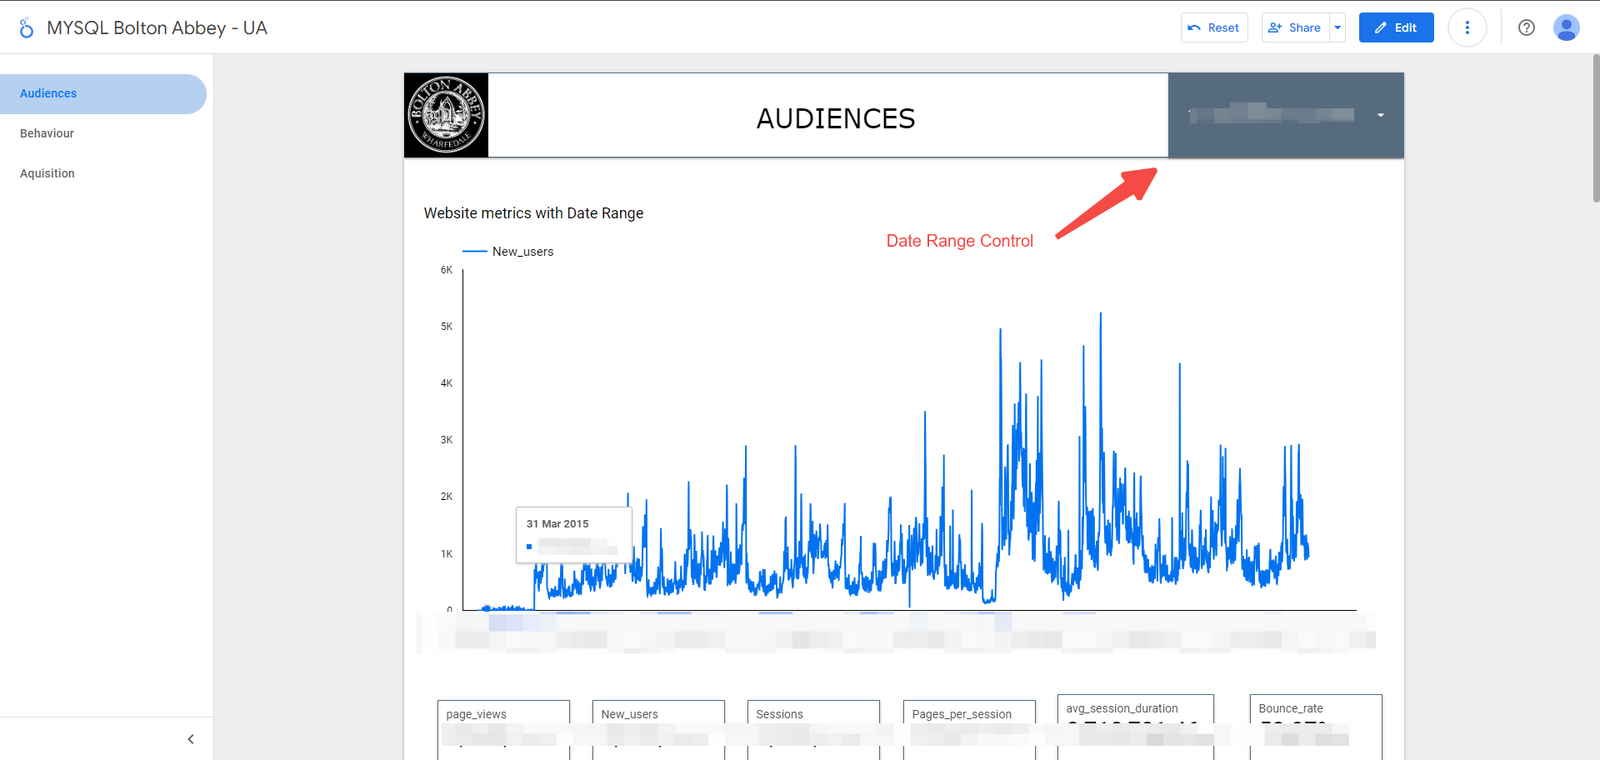
We backed up the client’s Universal Analytics (UA) data, ensuring that all important metrics and dimensions were captured. The data was then organized into a Looker Studio report with three main sections: Audience, Behavior, and Acquisition.
Features:
- Flexible Date Range: Users can select specific date ranges to view data for particular time periods.
- Quick Summary: Key metrics are displayed in scorecards for a clear and concise overview.
- Visual Insights: Pie charts show the percentage breakdown of categories, like device types, for easy comparison.
- Customizable Views: Users can filter the data by different dimensions, such as channel group, source, medium, referrer, or campaign.
- Future Updates: The report can be easily updated or modified to meet changing needs.
Results
The detailed backup provided for the client’s Universal Analytics (UA) data ensured a reliable and accessible resource for ongoing analysis. The Looker Studio report offered a comprehensive view of historical data, preserving all key insights during the transition from UA. With features like date range control, aggregated scorecards, pie charts, and customizable views, the report made it easy to analyze and extract valuable insights, ensuring that no critical information was lost and providing flexibility for future updates.
Conclusion
The backup and Looker Studio report provided the client with a clear and accessible view of their Universal Analytics data. The report preserved all important insights and made it easy to analyze historical data. Features like date range selection, scorecards, charts, and filters ensured that no valuable information was lost and that the report can be easily updated in the future. This solution streamlined the transition and supported ongoing data analysis and decision-making.