Case Study - Devonshire
DASHBOARD
Client Overview
Devonshire Arms Hotel offers a charming and luxurious retreat in the heart of the countryside. With its elegant accommodations and exceptional service, the hotel provides a perfect escape for relaxation and rejuvenation. Guests can enjoy beautifully appointed rooms, exquisite dining options, and a range of amenities designed to ensure a comfortable and memorable stay. The Devonshire Arms Hotel combines classic hospitality with modern comforts, making it an ideal destination for both leisure and business travelers seeking an upscale and serene experience.

Requirements
They asked for a complete backup of data from 2019 to 2023, with a total size of 866 MB. Backing up this data ensured that historical insights are preserved, helping Devonshire to continue making informed decisions based on past performance, even after the transition to Google Analytics 4.
Solution
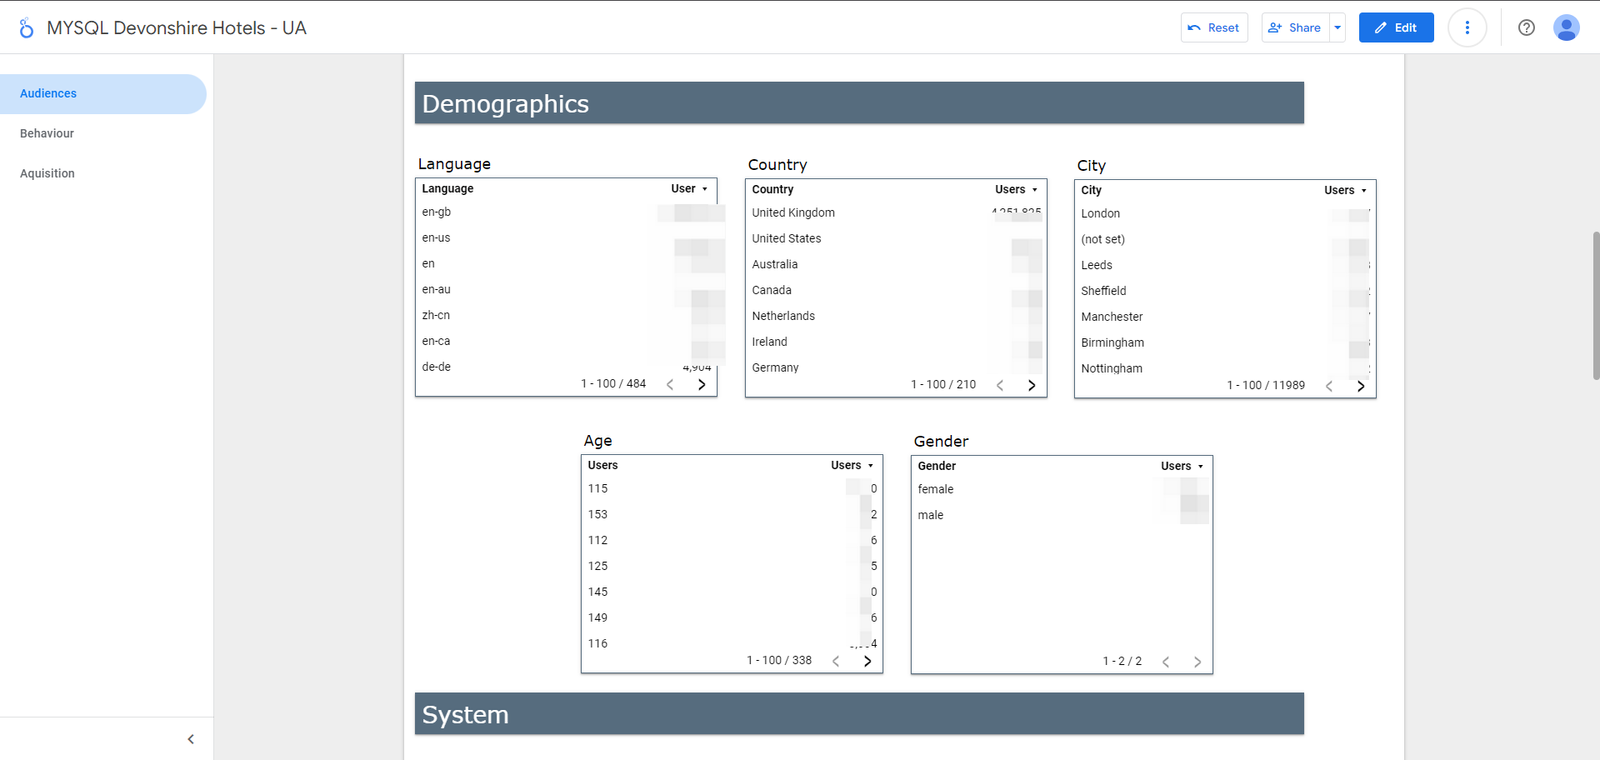
The report was designed and implemented in Looker Studio to back up essential data and provide clear visual representations of Audience, Behavior, and Acquisition metrics. The following sections detail the approach taken:
- Audience Analysis:
- Scorecards: We utilized scorecards to display an aggregated view of key metrics, including Users, Sessions, Page Views, Pages per Session, Average Session Duration, and Bounce Rate. This provides a quick snapshot of overall site performance.
- Time Series Graphs: Two time series graphs were created:
- Users: This graph shows the trend of total users helping to identify growth patterns and user retention.
- Session Information: This graph tracks sessions over time, indicating periods of high or low engagement.
- Bar Charts: A bar chart was used to compare Page Views vs. Pages per Session, providing insights into user engagement on different pages.
- Pie Charts: The technical information, including Browser, Operating System, Screen Resolution, and Device Category, was represented in pie charts. This visual approach helps in understanding the distribution of user technology preferences.
- Active Users: The report also includes metrics for 1-Day, 7-Day, 14-Day, 28-Day, and 30-Day Active Users, which offers insight into user engagement over various periods.
- Behavior Analysis:
- Scorecards: The Behavior section utilized scorecards to back up data on Page Views, Unique Page Views, Average Time on Page, and other related metrics, offering a detailed look at user interaction on specific pages.
- Bar Charts: A bar chart was created to compare Page Views vs. Unique Page Views and Bounce Rate vs. Exit Percentage. This comparison helps identify the effectiveness of content and potential areas of improvement.
- Tables: Site content data, including Top Pages, Landing Pages, and Exit Pages, was backed up in tabular form. This detailed view supports an in-depth analysis of user behavior and page performance.
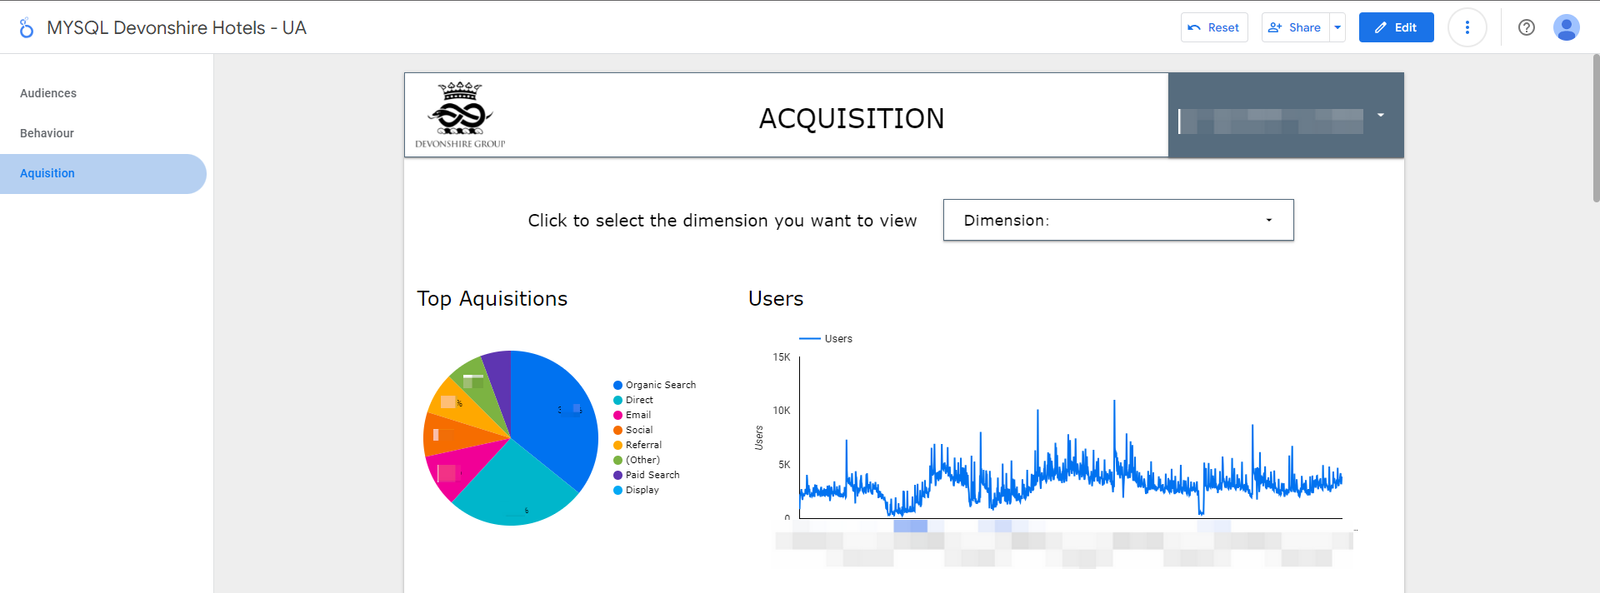
- Acquisition Analysis:
- Pie Chart: A pie chart was used to depict the percentage of each traffic channel (e.g., Organic Search, Direct, Referral, Social). This visual aids in understanding which channels drive the most traffic.
- Detailed Table: A table was created to represent comprehensive information on Channel Group, Source/Medium, Campaign, and Referrer. The table allows for drill-down capabilities, enabling a more granular analysis of acquisition data and helping to identify the most effective channels and campaigns.
This structured and visual approach in Looker Studio not only backs up critical data but also provides a clear and insightful representation of key metrics, making it easier to analyze trends and make informed decisions.
Features:
- Flexible Date Range: Users can select specific date ranges to view data for particular time periods.
- Quick Summary: Key metrics are displayed in scorecards for a clear and concise overview.
- Visual Insights: Pie charts show the percentage breakdown of categories, like device types, for easy comparison.
- Customizable Views: Users can filter the data by different dimensions, such as channel group, source, medium, referrer, or campaign.
- Future Updates: The report can be easily updated or modified to meet changing needs.
Results
The detailed backup provided for the client’s Universal Analytics (UA) data ensured a reliable and accessible resource for ongoing analysis. The Looker Studio report offered a comprehensive view of historical data, preserving all key insights during the transition from UA. With features like date range control, aggregated scorecards, pie charts, and customizable views, the report made it easy to analyze and extract valuable insights, ensuring that no critical information was lost and providing flexibility for future updates.
Conclusion
The backup and Looker Studio report provided the client with a clear and accessible view of their Universal Analytics data. The report preserved all important insights and made it easy to analyze historical data. Features like date range selection, scorecards, charts, and filters ensured that no valuable information was lost and that the report can be easily updated in the future. This solution streamlined the transition and supported ongoing data analysis and decision-making.


