Case Study – NUSTONE
DASHBOARD
About Client
Nustone, a premier UK-based company, has been upgrading outdoor and indoor spaces with its top-tier paving, flooring, and walling products for over 20 years. Using only the highest quality materials, they guarantee to offer exceptional value at competitive prices. Their efficient coordination ensures timely deliveries, and their outstanding reviews attest to their quality and reliability.

Requirements
Nunstone was looking to unlock a deeper understanding of their e-commerce journey. To achieve this, they envisioned an Overview Section, Sales Performance, Customer Insights, Marketing & Traffic, Order Details, and Product Performance dashboard that highlights segmented events through a streamlined interface, with an added hourly revenue breakdown for a thorough performance analysis.
Solution
In line with Nunstone’s goal of a clearer understanding of their e-commerce journey, we curated a comprehensive report tailored to their needs. This report provided a detailed breakdown of key metrics, providing a clear and engaging overview of their data with the help of:
Similarly, GA4 offers a capability to track ‘page_view’ changes in SPA and for other tags, we used the ‘History Change’ trigger. As for the dataLayer implementation, we coordinated with Development Team and provided them with detailed documentation and assistance for implementing the same.
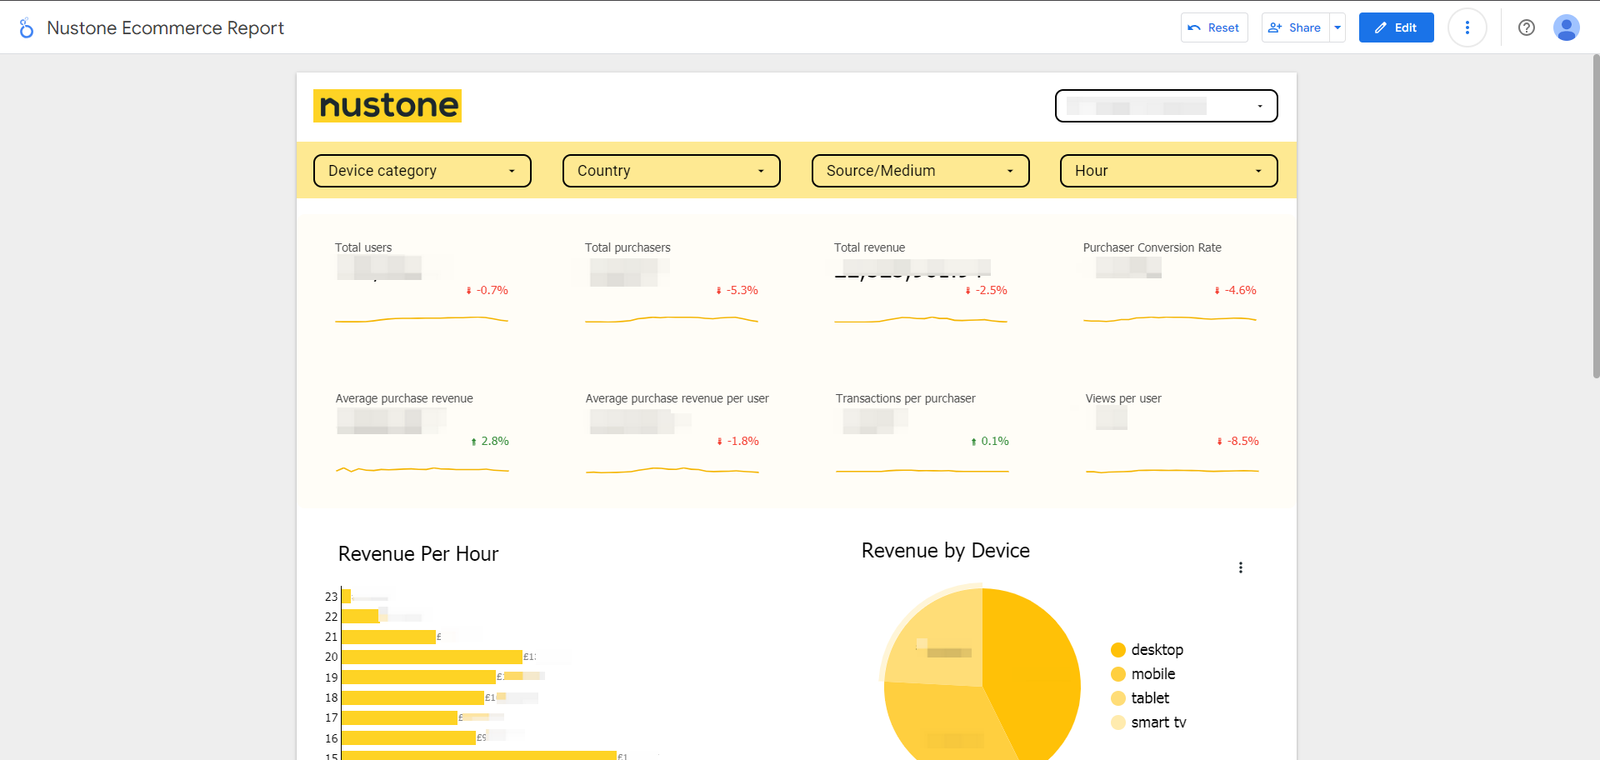
- Hourly Revenue and Average Order Value: We combined data to display revenue per hour and average order value, segmented by device category, country, source/medium, and hour.
- Scorecards: Eight scorecards offer a concise summary of user behavior, including total users, total purchasers, total revenue, purchase conversion rate, average revenue per user, average purchase revenue, transactions per purchaser, and views per user.
- Bar Chart: A visually stimulating bar chart displaying total revenue per hour, offering insights into revenue patterns throughout the day.
- Pie Charts: Two pie charts illustrate average purchase revenue by device category and city, highlighting their respective impacts on overall revenue.
- User Purchase Journey: Lastly, four scorecards with concise numbers are available to monitor the user buying experience.
This comprehensive report showcased data clearly, concisely, and compellingly, aiding in informed decision-making.
Conclusion
This project produced a comprehensive e-commerce report that identified issues in Nunstone’s Google Analytics and Google Tag Manager setups.
We discovered that more items were added to the cart than viewed, suggesting a tracking discrepancy in their e-commerce events. By addressing this issue together, we were able to refine their data analysis approach, ultimately strengthening their decision-making process in the long run.

