Sankey Charts in Looker Studio
Advantages of Sankey Charts for Data Visualization:
Clutter Avoidance in Sankey Charts:
Types and Categories of Sankey Charts in Looker Studios:
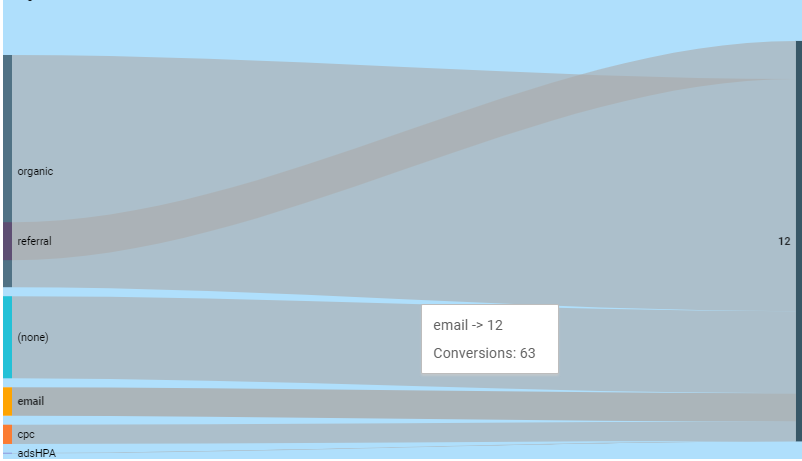
1. Sankey Chart:

For Example: Consider a financial analysis where a Sankey chart is utilized to showcase the allocation of a company’s budget among various cost centers. Nodes represent departments, and the flows between them represent the financial distribution, providing a clear picture of resource allocation.
Tips and Tricks for Sankey Charts:
1. Node Labeling: Clearly label nodes to identify the entities involved in the flow.
2. Flow Color Coding: Use distinct colors for different flows to enhance visual differentiation.
3. Tooltip Detailing: Provide detailed tooltips for nodes and flows to offer additional context upon user interaction.
4. Proper Scaling: Adjust the scale of the chart to prevent distortion and present an accurate representation of the flow.
5. Interactive Elements: Incorporate interactive features, such as highlighting specific flows or nodes, to facilitate a more engaging user experience.